.png)


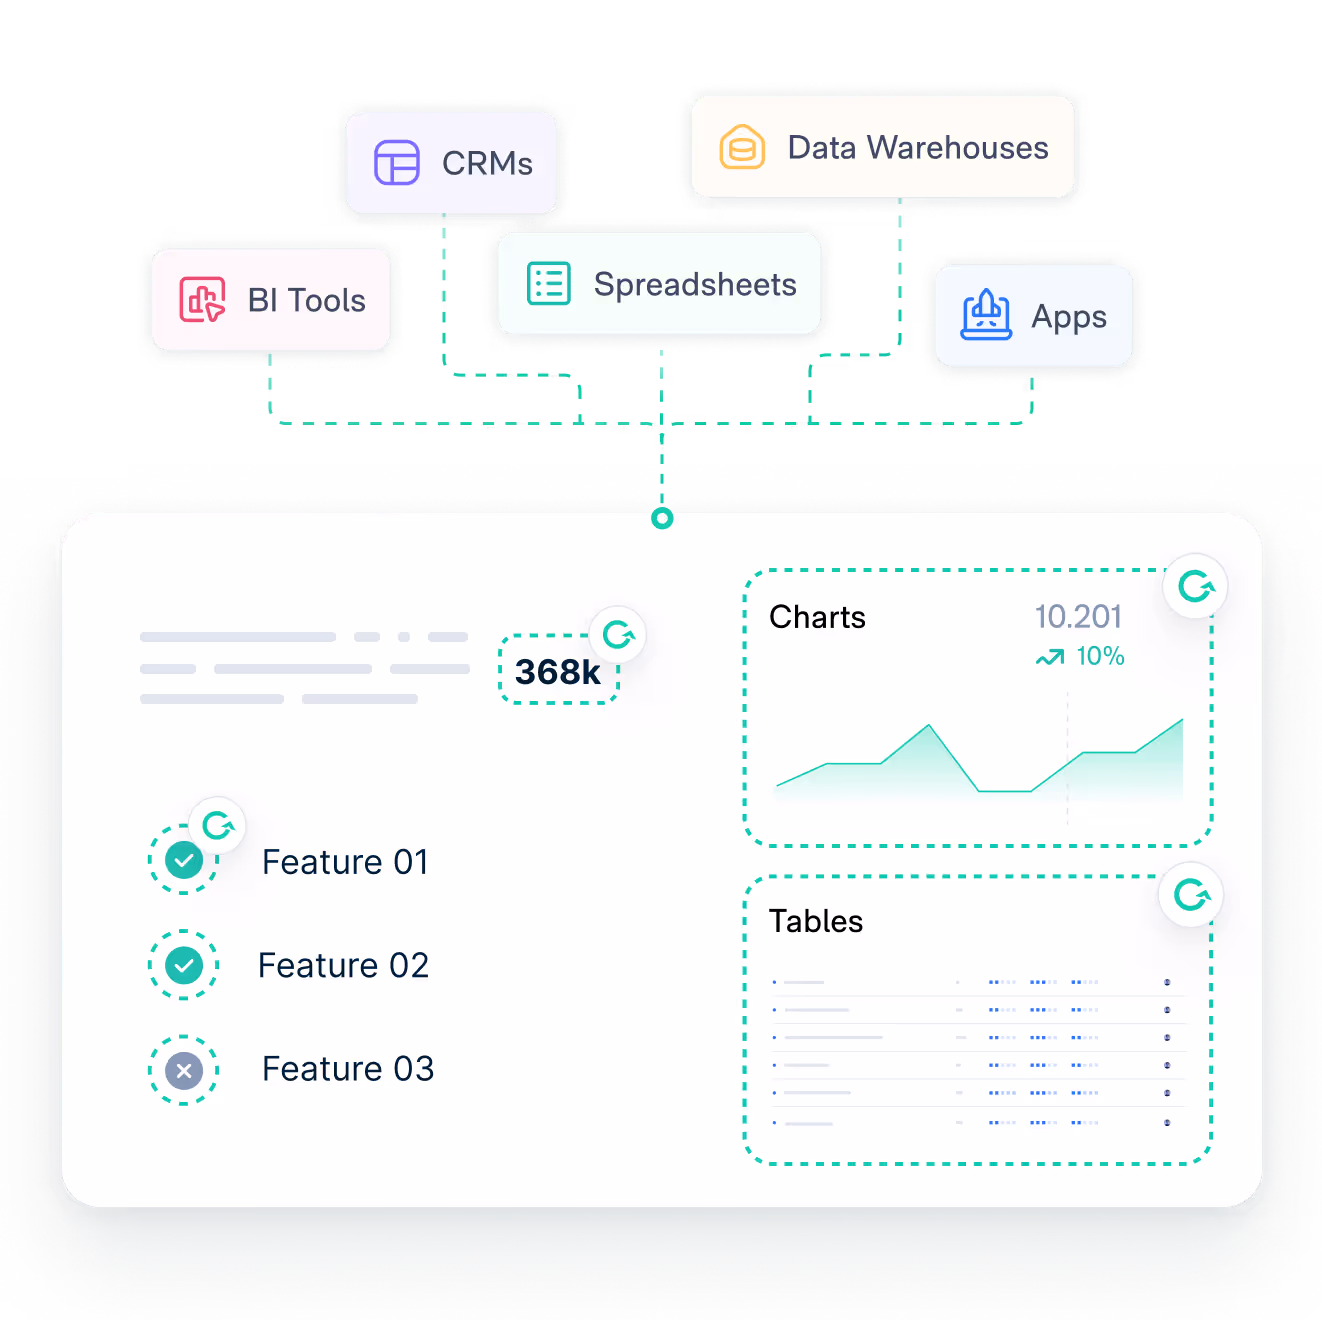
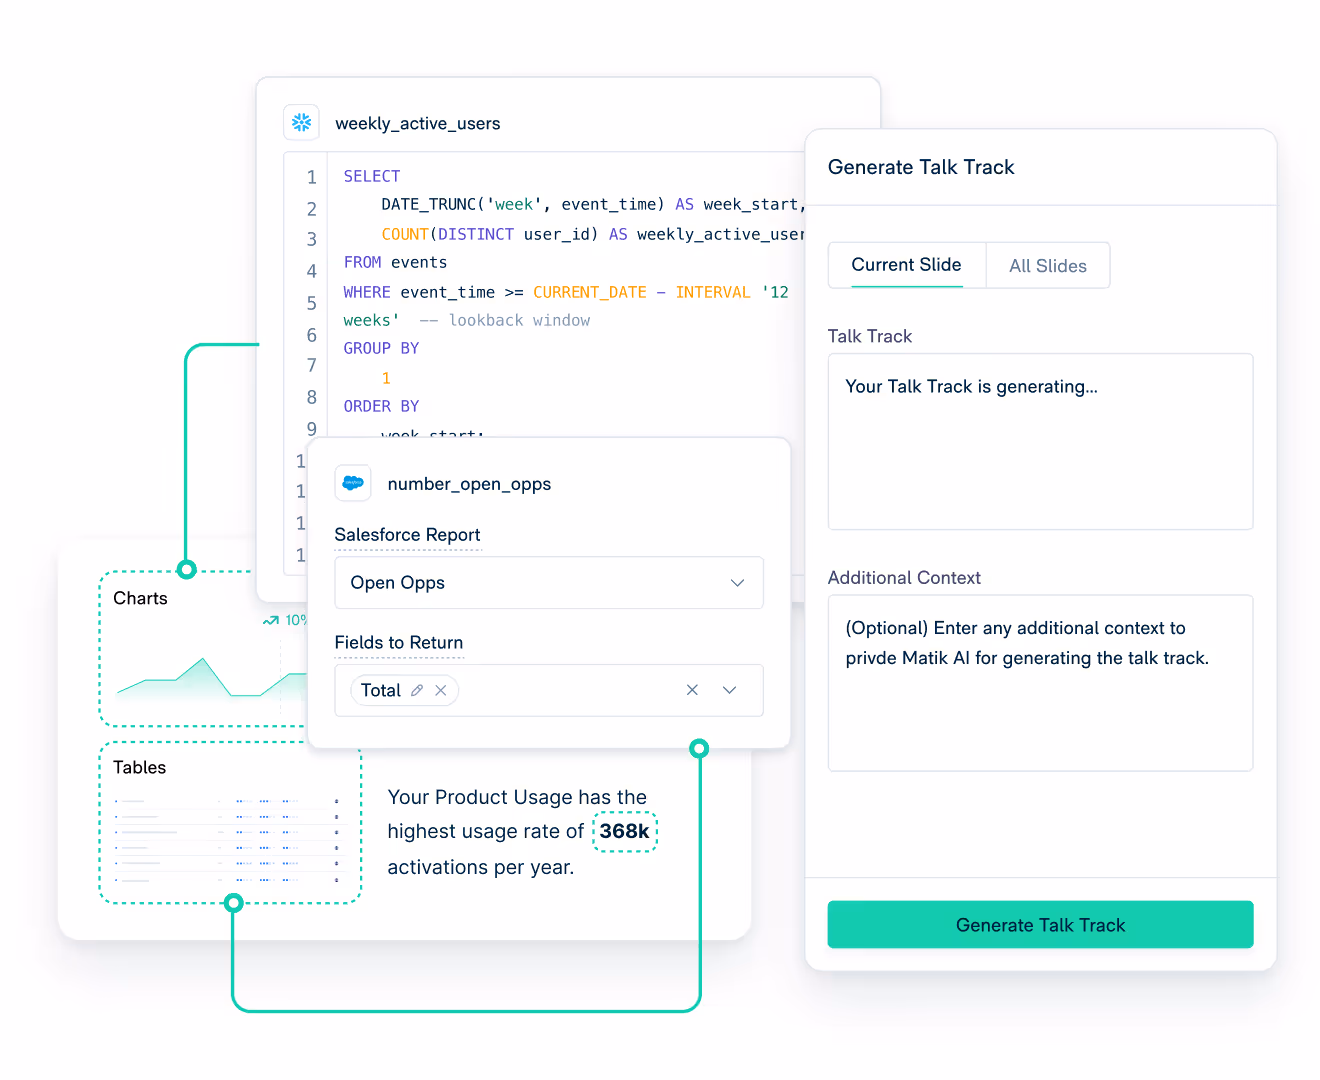
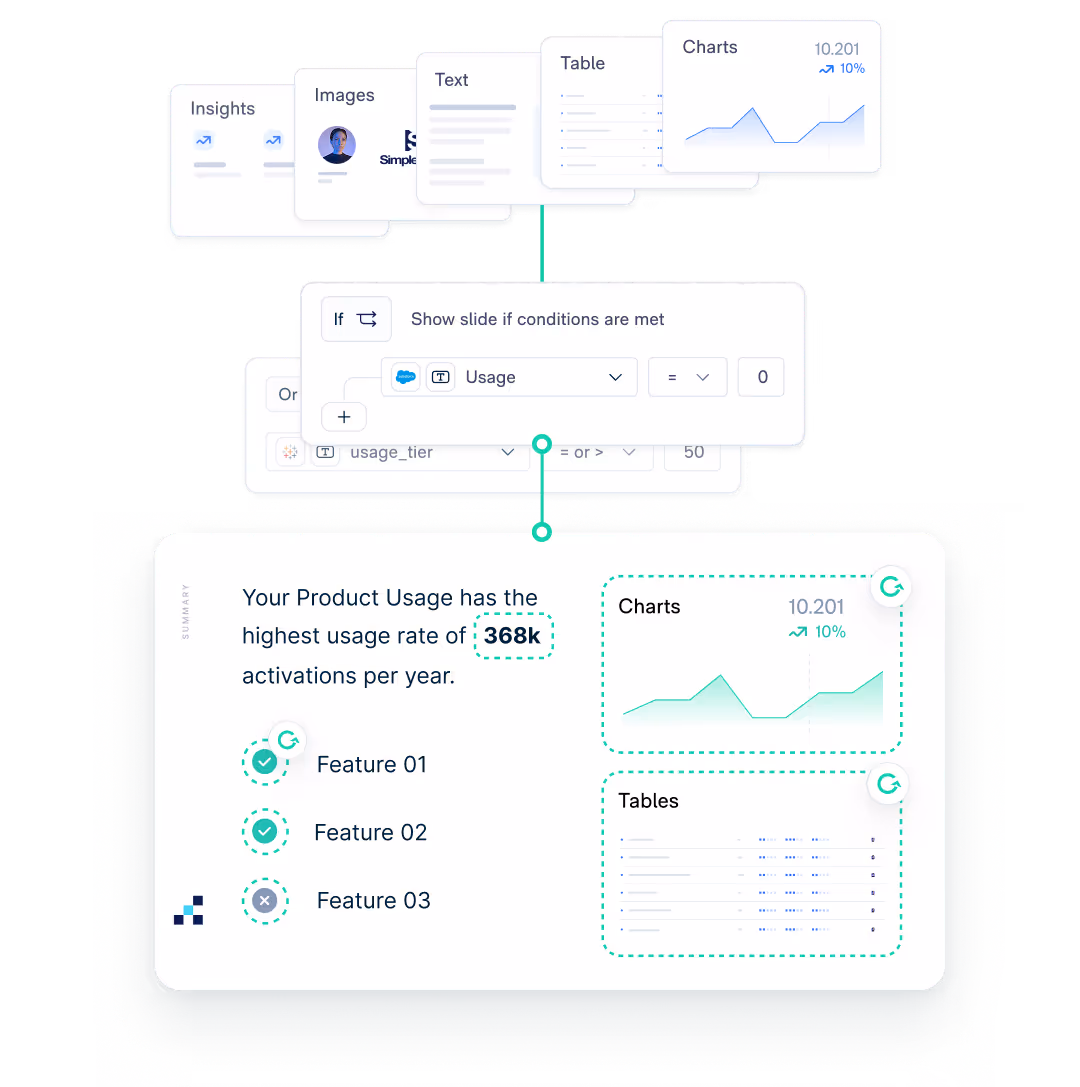
Automate text, visuals, and key insights in Looker - telling the right story using if-then logic and your existing data.


Automate Content Creation with Looker
Automate Content Creation with Looker
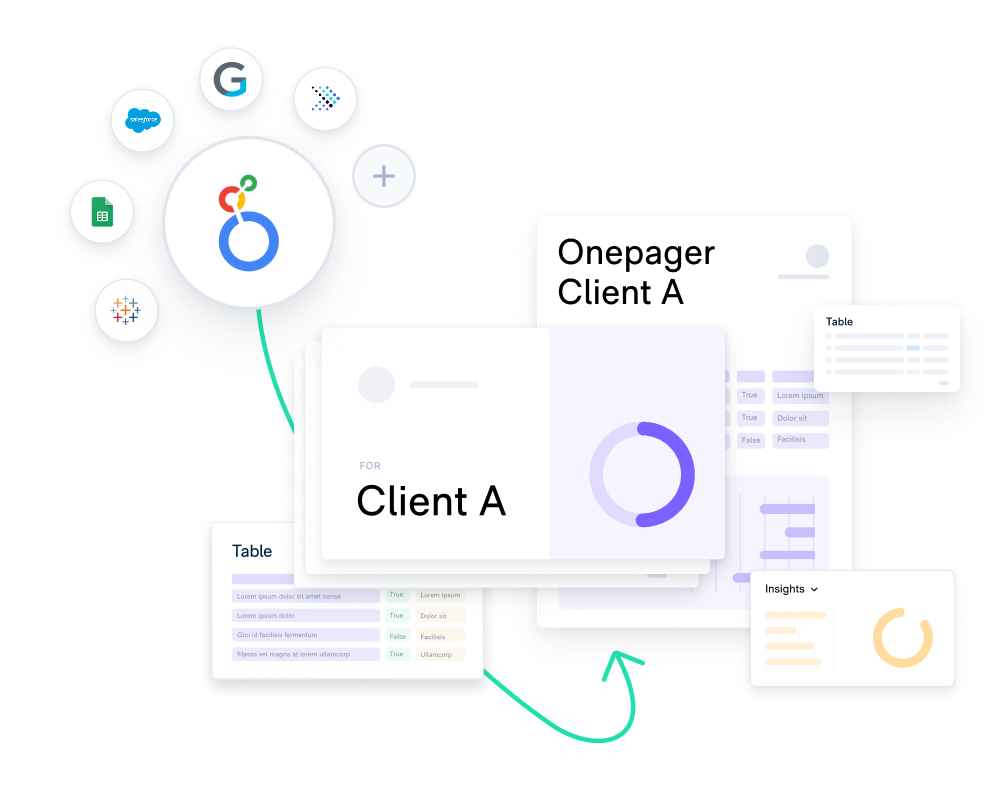
Learn more about how Matik can help you automate the creation & sending of any personalized presentation or one-pager using your Looker data.
Automate Content Creation with Looker

Interested in partnering with us? Email hello@matik.io
Request Demo

-1.svg)