Matik Q&A: Benchmarking

Nikola Mijic
-
February 7, 2022
-
2 minutes

“My customers want more data about how their teams are using our product. We already share usage data and other relevant details with them. What’s the next step?”
This is a great question, and we hear it all the time!
In business and in normal life, we’re constantly comparing ourselves to others. Maybe our new baby’s in the 85th percentile for weight, or we scored in the 95% percentile on a standardized test, or our company is one of ten to win a prestigious award.
This type of “comparison” is also referred to as “benchmarking,” and it gives us a barometer to gauge how well we’re doing as compared to our peers.
We’ve become accustomed to a world filled with this type of data, and our customers have, too.
It’s no longer enough to share siloed information to your users based on how only they interact with your product. Customers also want to know how they stack up against your other customers and to their competitors.
So, where do you start?
First things first, which new insights and data points do you want to surface to your customers?
Maybe you want to show your users how the amount of time they’re spending in your product compares to your most successful users.
Or you can surface data about which features your customers are using most, and show them how other customers in their industry are using additional features to better leverage your product.
Whatever you benchmark, you should also be working toward a larger business objective. Ideally, in giving customers what they want (more data!), you can also achieve an internal goal to increase usage, upsell new features, or just create an overall stickier product.
Next, you’ll need to decide on some parameters for this data collection.
Let’s say you decided to surface benchmarking data around how much time your users spend in your product, as compared to your other users.
But who are those other users? Are you comparing your customers to their competitors? To other customers in their vertical? To other companies in their segment?
And are you measuring this data over all time, or during a specific timeframe?
Once you have the data points you’re collecting, and the parameters for your analysis, it’s time to start thinking about how you’ll present this data to your customers.
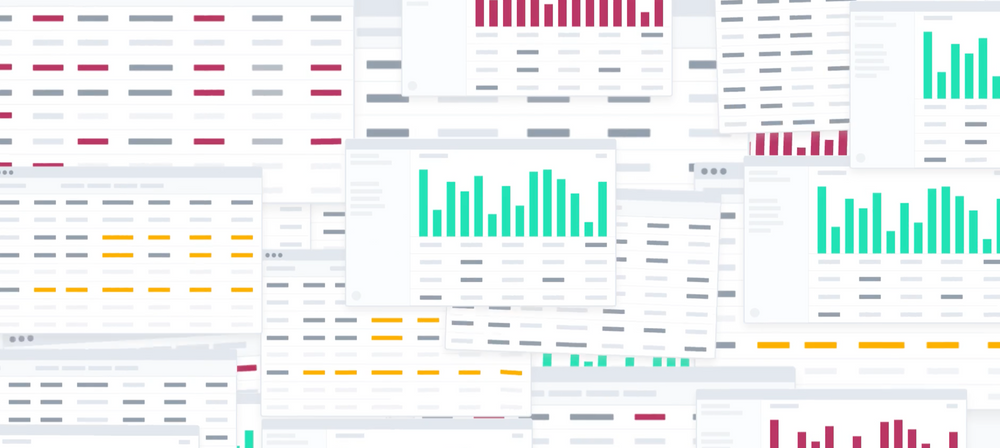
This last element is crucial, as you want to make sure that you display the benchmarked data in a way that is easily consumable and understandable by your audience. Check out an example below that we use here at Matik:

The visualization should also communicate any next steps for the user to take to help you achieve your internal business objectives.
If your customer is a power user, communicate that and show them they’re at the top as compared to their competitors, and that your product is central to their work.
If a team’s usage is low, give them next steps for how they can improve their engagement and catch up to their competitors.
Start having these conversations with your team sooner than later!
And if you’re looking for a data presentation platform to help you automate the process and deliver benchmarking insights to your customers efficiently, consider exploring Matik. Matik makes it easy to empower your customers with valuable insights and drive better business outcomes.
---
Ready to try Matik? Request a Demo

“My customers want more data about how their teams are using our product. We already share usage data and other relevant details with them. What’s the next step?”
This is a great question, and we hear it all the time!
In business and in normal life, we’re constantly comparing ourselves to others. Maybe our new baby’s in the 85th percentile for weight, or we scored in the 95% percentile on a standardized test, or our company is one of ten to win a prestigious award.
This type of “comparison” is also referred to as “benchmarking,” and it gives us a barometer to gauge how well we’re doing as compared to our peers.
We’ve become accustomed to a world filled with this type of data, and our customers have, too.
It’s no longer enough to share siloed information to your users based on how only they interact with your product. Customers also want to know how they stack up against your other customers and to their competitors.
So, where do you start?
First things first, which new insights and data points do you want to surface to your customers?
Maybe you want to show your users how the amount of time they’re spending in your product compares to your most successful users.
Or you can surface data about which features your customers are using most, and show them how other customers in their industry are using additional features to better leverage your product.
Whatever you benchmark, you should also be working toward a larger business objective. Ideally, in giving customers what they want (more data!), you can also achieve an internal goal to increase usage, upsell new features, or just create an overall stickier product.
Next, you’ll need to decide on some parameters for this data collection.
Let’s say you decided to surface benchmarking data around how much time your users spend in your product, as compared to your other users.
But who are those other users? Are you comparing your customers to their competitors? To other customers in their vertical? To other companies in their segment?
And are you measuring this data over all time, or during a specific timeframe?
Once you have the data points you’re collecting, and the parameters for your analysis, it’s time to start thinking about how you’ll present this data to your customers.
This last element is crucial, as you want to make sure that you display the benchmarked data in a way that is easily consumable and understandable by your audience. Check out an example below that we use here at Matik:
The visualization should also communicate any next steps for the user to take to help you achieve your internal business objectives.
If your customer is a power user, communicate that and show them they’re at the top as compared to their competitors, and that your product is central to their work.
If a team’s usage is low, give them next steps for how they can improve their engagement and catch up to their competitors.
Start having these conversations with your team sooner than later!
And if you’re looking for a data presentation platform to help you automate the process and deliver benchmarking insights to your customers efficiently, consider exploring Matik. Matik makes it easy to empower your customers with valuable insights and drive better business outcomes.
---
Ready to try Matik? Request a Demo