Experimenting with ChatGPT for Customer Success Processes

Bex Sekar
-
February 21, 2023
-
5 minutes

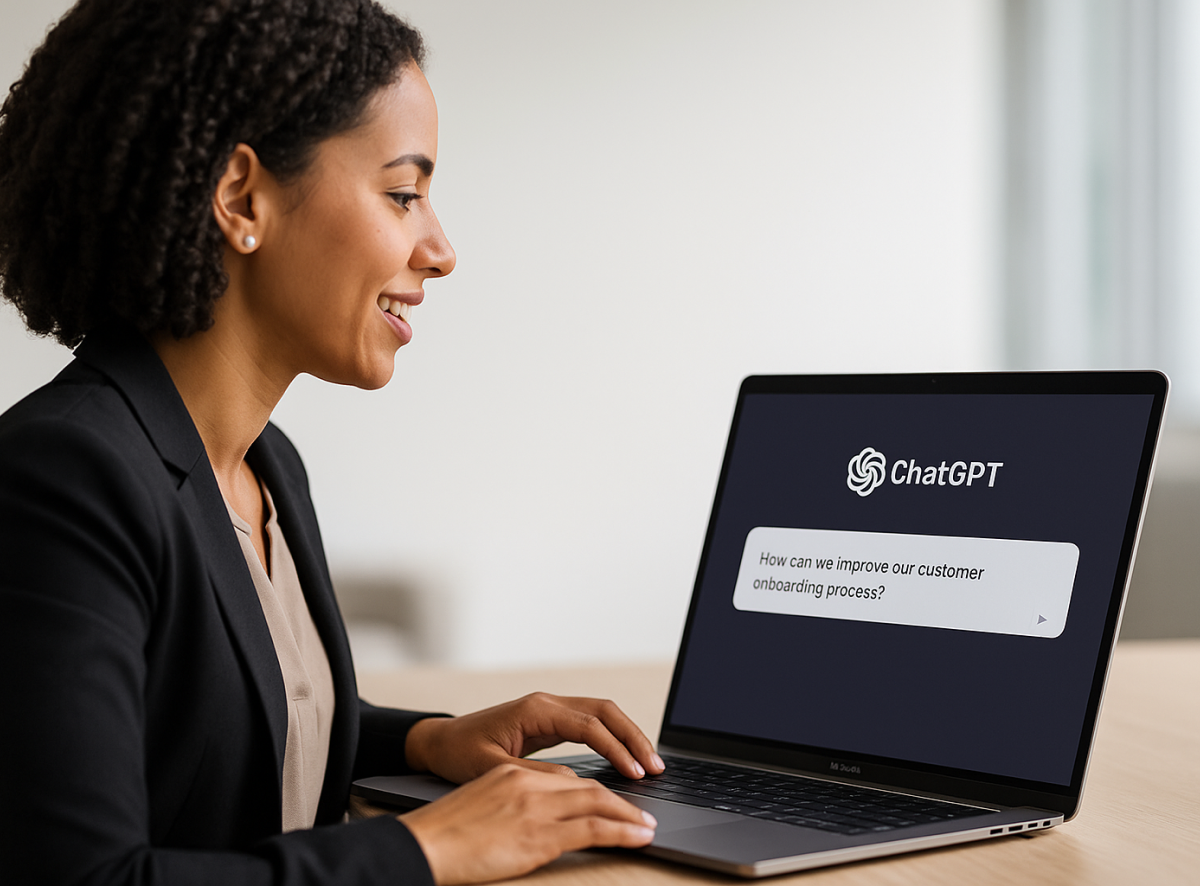
If you work in customer success and are worried about AI replacing you, the great news is that’s definitely not happening soon for many reasons. For example, when you ask ChatGPT how to create a quarterly business review, you'll get suggestions that are probably not what you’re thinking of for your next customer meeting. When we asked ChatGPT to build a QBR for us, it was missing a few essential pieces:
However, ChatGPT can be a powerful tool when you’re building your next business review deck or doing any sort of ROI analysis. Here are some prompts to help you do quick research and further tailor your next prospect or customer conversation:
While ChatGPT can't fully automate the process of QBR creation, there are other tactics that can be used to simplify the process and make life easier for customer success teams. Here are some steps you could follow to automate the creation of QBRs:
These are just general steps, and the exact process for automating the creation of QBRs may vary depending on your specific needs and the tools you use.
Finally, we ran another test on ChatGPT to see how good it’s answer was—this time we asked it how to create an ROI analysis. The answer was fine if you’re creating a generic, internal ROI analysis, but if you’re creating one for a sales prospect or current customer, we can’t recommend it. (Yes, we did try how do I create an ROI analysis for a sales prospect, and it basically replaced the word investment with sales prospect).
Here’s the high-level approach we recommend:
At Matik, we also provide an ROI estimate for scaling data-driven content, and for creating more data-driven content & more touchpoints for each account.
Want to make QBR creation easier while still keeping content personalized? Check out our Essential QBR Presentation Template here, and our QBR One-Pager Template here.
---
Interested in Matik? Request a Demo